Grafana
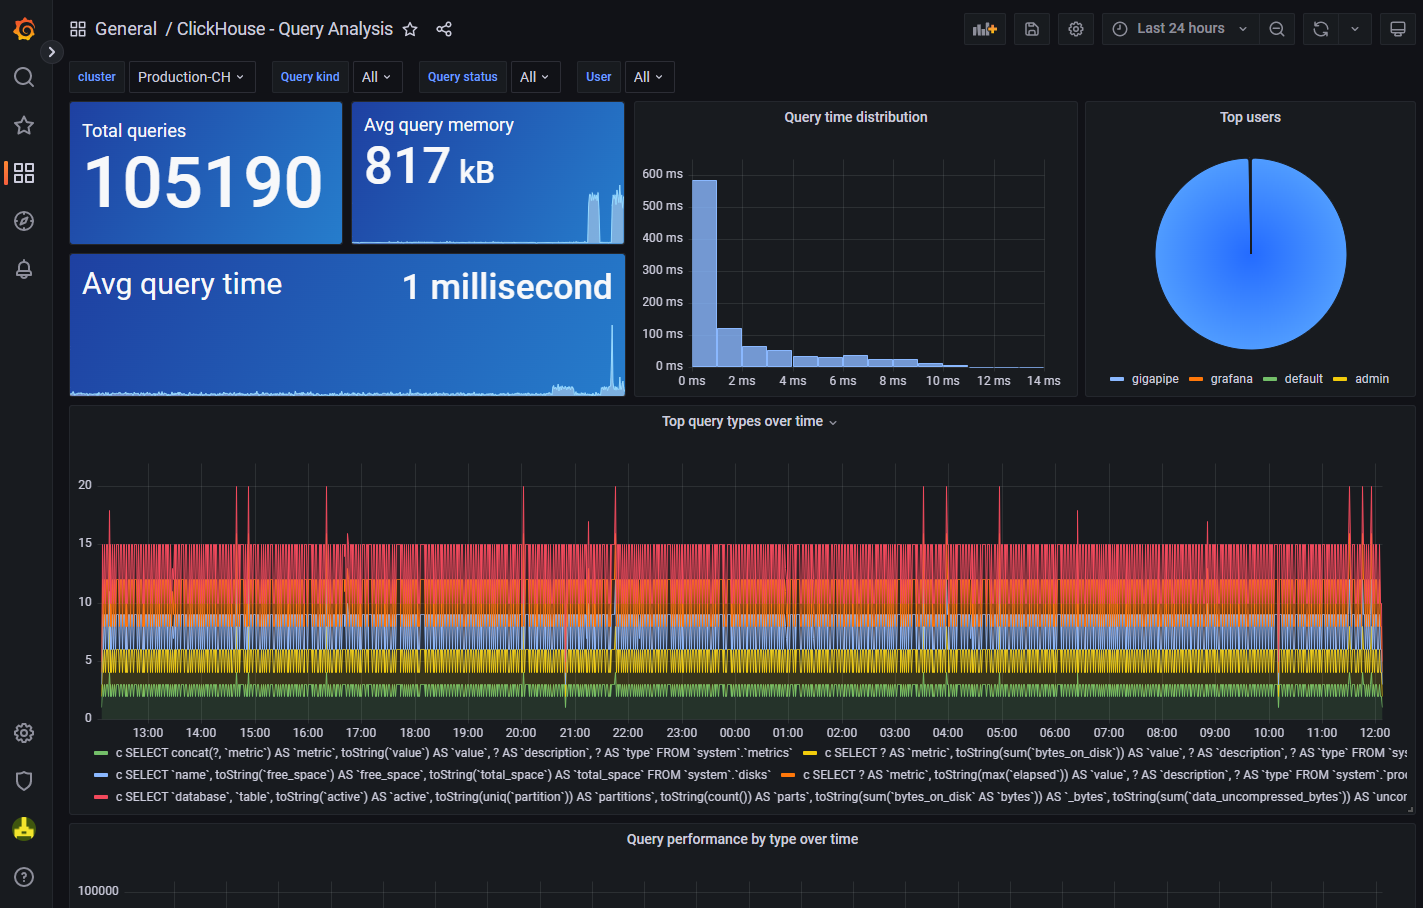
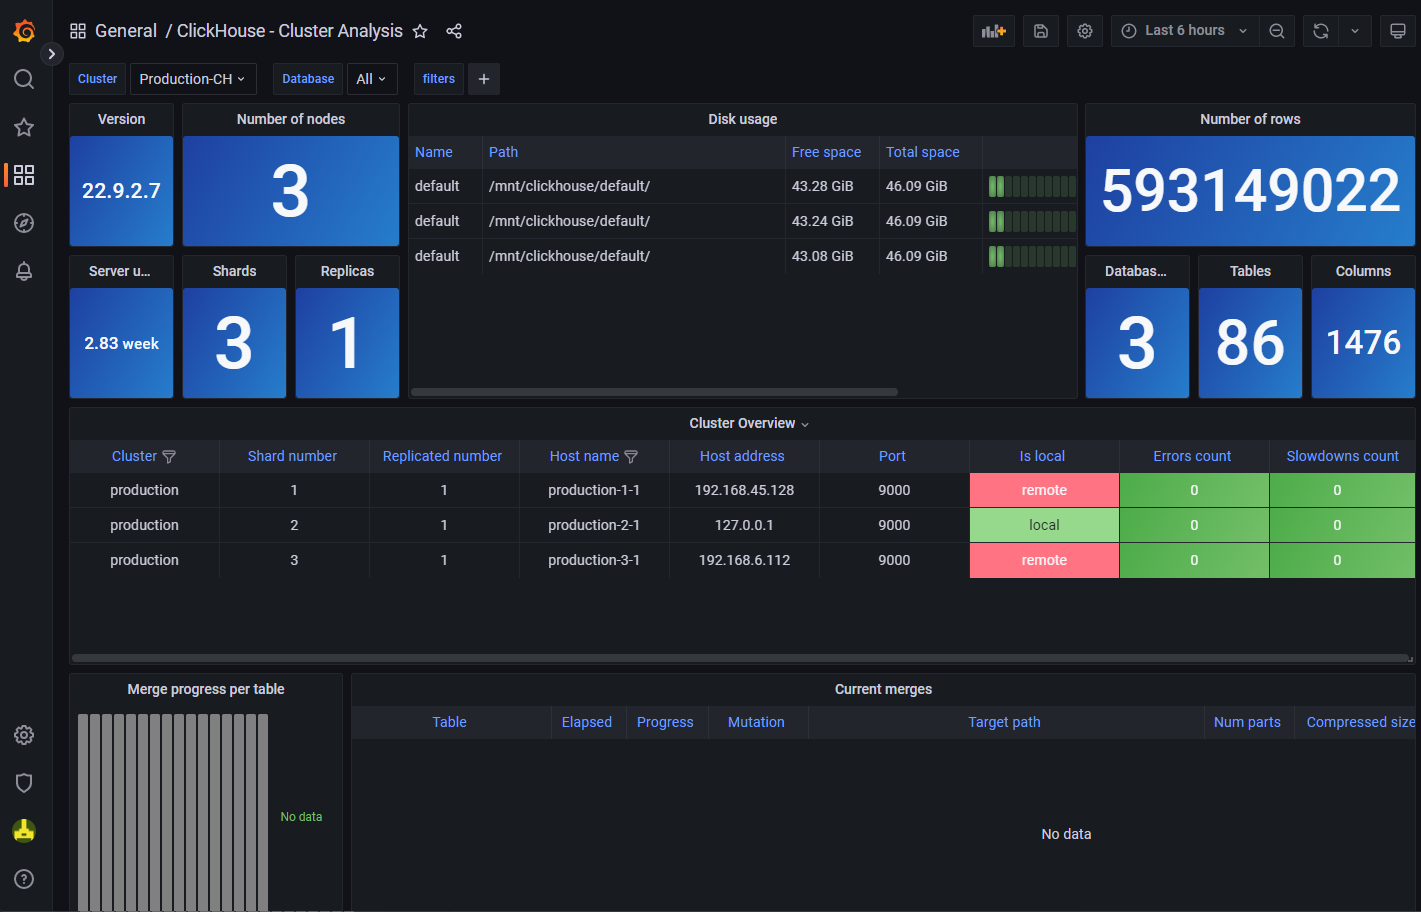
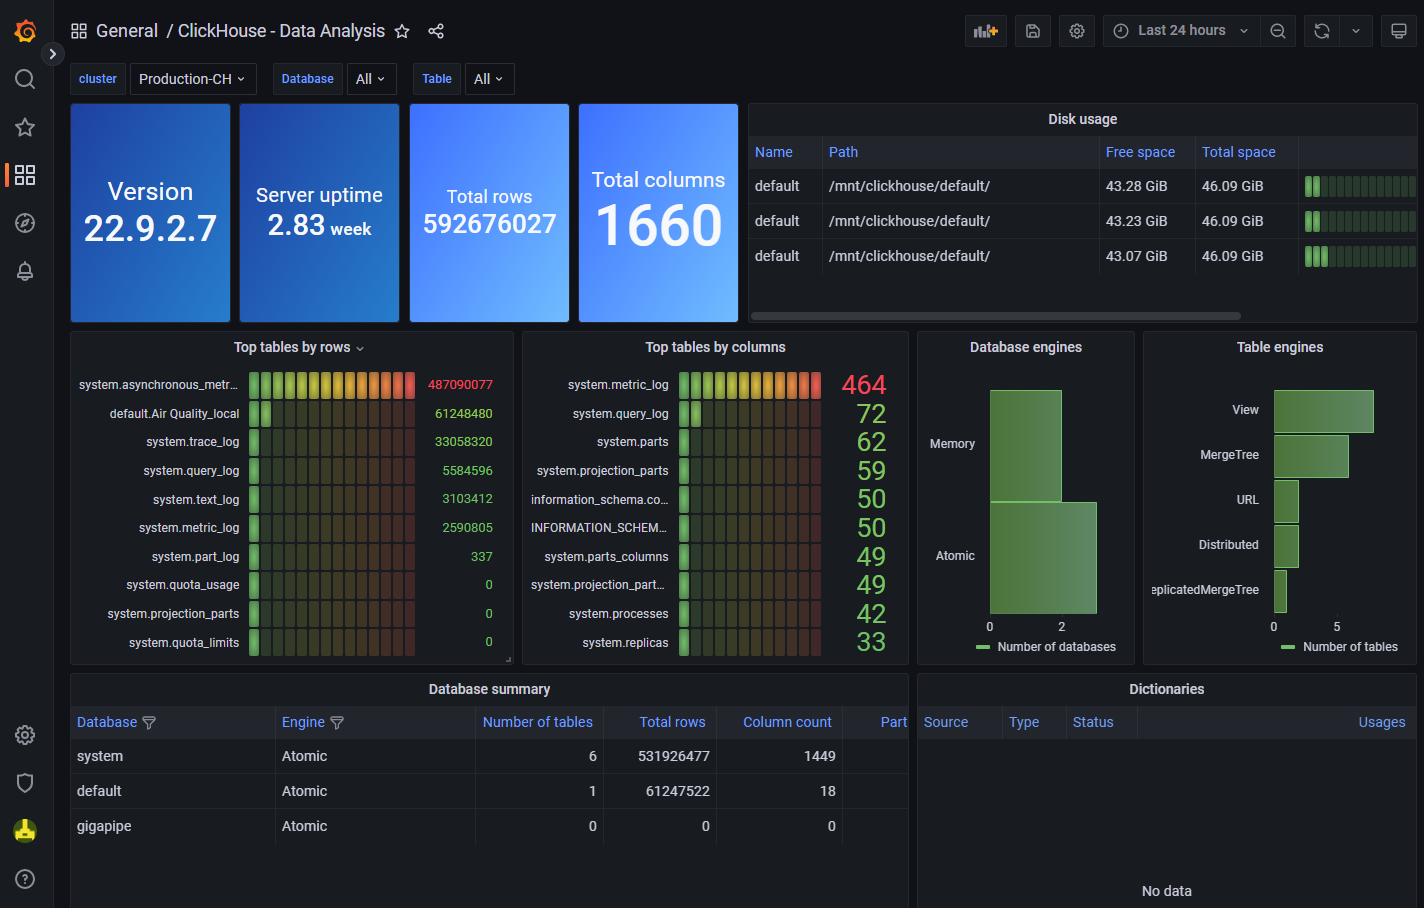
Grafana allows you to query, visualize, alert on and understand your metrics no matter where they are stored. Create, explore, and share beautiful dashboards with your team and foster a data driven culture.
The easiest way to get started is with Grafana Cloud, our fully composable observability stack.

Data everyone can see
Grafana was built on the principle that data should be accessible to everyone in your organization, not just the single Ops person.
By democratizing data, Grafana helps to facilitate a culture where data can easily be used and accessed by the people that need it, helping to break down data silos and empower teams.
Dashboards that anyone can use
Not only do Grafana dashboards give insightful meaning to data collected from numerous sources, but you can also share the dashboards you create with other team members, allowing you to explore the data together.
With Grafana, anyone can create and share dynamic dashboards to foster collaboration and transparency.


Unify your data, not your database
Grafana doesn’t require you to ingest data to a backend store or vendor database. Instead, Grafana takes a unique approach to providing a “single-pane-of-glass” by unifying your existing data, wherever it lives.
With Grafana, you can take any of your existing data- be it from your Kubernetes cluster, raspberry pi, different cloud services, or even Google Sheets- and visualize it however you want, all from a single dashboard.
Transformations
Transformations allow you to rename, summarize, combine, and perform calculations across different queries and data sources.
Alerts
With Grafana Alerting, you can create, manage, and silence all of your alerts within one simple UI— allowing you to easily consolidate and centralize all of your alerts.
Annotations
Annotate graphs with rich events from different data sources. Hover over events shows you the full event metadata and tags.

What our clients say
Frequently Asked Questions
Gigapipe is a managed platform for observability and monitoring tools. Single click deployments for all integrations as well as immediate interoperability between all applications (no code required!). Our primary general observability tool (qryn Cloud) comes with ingestion APIs transparently compatible with Loki, Prometheus, Tempo, InfluxDB, Elastic and more.
You decide exactly which region your data services are deployed in and your data will never leave that region unless specified. Your data flows between the deployed services, never directly through Gigapipe itself.
Gigapipe has an available free tier for individual engineers or developers. This is free forever. Organization mode has a monthly fee of $249 which allows access to higher tiers of some integrations, as well multiple projects/environments, multiple users and teams as well as advanced role based access control.
Each individual integration has its own pricing model based on the service. Either flat subscriptions or metered usage.
With a single click! Gigapipe not only creates and deploys your services, but it also connects them all together. You can link deployed data services together at the click of a button from within the stack.
Not at all – it replaces them. We simply allow using Grafana (the user-interface, unmodified) and its native datasources, while all other components and APIs are entirely provided by qryn and ClickHouse. qryn is a clear room implementation and it is not a fork and does not contain any code from Grafana or its projects.
Alternatives play an important role and can accelerate evolution in an lively ecosystem. qryn is just designed to make its end users happy and was implemented as a transparent, smart, lightweight overlay on top ClickHouse, where all data ingested across protocols sits ready to be accessed, analyzed and correlated in thousands of way today and into the future leveraging its fast and ever growing capabilities.
If you’re using any of the many compatible clients, then simply a the host to the qryn host and it is an automatic drop in replacement. Logs, Metrics and traces will be transparently ingested and immediately available through qryn!
For a full list of compatible clients for logs, metrics and traces please check here: https://qryn.metrico.in/#/logs/ingestion
Simple. You can connect any query or dashboarding application supporting Loki, Prometheus, Tempo/Opentelemetry APIs to qryn.cloud, without requiring plugins, extensions or modifications.
For example, Grafana native datasources can be used with qryn out of the box.
Get Started
Seeing is believing. Ready to try it for yourself?


