
Use Grafana, replace the rest with Gigapipe.
Gigapipe integrates with leading open-source tools via APIs, including Prometheus for metrics, Loki for logs, and Pyroscope for Tracing, HEPIC for VoIP tracing, all enhanced with a powerful Grafana stack for unified visualization.
Eliminates the need for separate systems like Loki, Tempo, and Prometheus backends.
Consolidates logs, metrics, traces, and profiling in a single platform.
One engine to store, query, and correlate everything.
Solutions for modern observability
Gain deep insights into network performance with Gigapipe's metric observability. Track KPIs like call success rates, latency, and resource utilization in one place, enabling proactive optimization and troubleshooting across your telco infrastructure.
Polyglot Compatibility
Supports multiple ingestion and query protocols out-of-the-box.
Seamlessly integrates with existing tools and agents — zero vendor lock-in.
Unified Storage Layer
Built on ClickHouse, a high-performance OLAP database.
Stores all observability data in a single correlated format.
Offers blazing-fast queries, efficient compression, and deep correlation capabilities.
Flexible Deployment
Deploy on-premise, in your cloud, or fully managed.
Supports ClickHouse and S3-compatible object storage for maximum control.
Designed for hybrid and large-scale distributed environments.
Open Source & Vendor-Agnostic
Community-driven and fully transparent.
No vendor lock-in — extend, self-host, script, and customize freely.
Designed as a "polyglot pipe" for your telemetry data.
Integrate with any data source from everywhere
Predictable pricing with wide limits and no hidden metering.
Significantly cheaper than Grafana Cloud, Datadog, or other SaaS observability vendors.
Free
Open-source
Open source Gigapipe
Configurable RAM
Configurable vCPU
Configurable Storage
Unlimited usage
AGPLv3
Community support
Pro
Fully configurable. Starts with a 14-day free trial.
Up to 5 TB/month Ingestion
360 GB NVMe Storage (stores ~1.5 TB of ingested data)
Up to 16 vCPUs & 32 GB RAM
14-day free trial
Standalone deployment
Email & Helpdesk Support
€479
/month
Billed yearly, or €599 billed monthly. Customize storage on the pricing page
Enterprise
For full stack monitoring over large scale deployments
Custom resources matching desired monthly telemetry ingestion
High Availability & multi-node cluster deployment
Custom data retention
Dedicated SLA
Premium support
Onboarding & migration assistance
Built for performance and scale: minimal resource footprint.
Unmetered ingestion and querying — performance is limited only by your infrastructure.
Ideal for high-throughput environments.
About us
Gigapipe is a polyglot observability platform that unifies logs, metrics, traces and profiles in a single, high-performance engine — without silos, vendor lock-in, or unpredictable costs.
Born in 2018 as the open-source project "cLoki," it matured into a production-grade drop-in alternative to Grafana Cloud/LGTM — natively compatible with OpenTelemetry, Loki, Prometheus, Tempo, Pyroscope, InfluxDB, Elastic and Datadog, all on a single ClickHouse-powered stack.
Flat-rate pricing. Full data ownership. AGPLv3 open-source. Built by engineers, for engineers — and designed to scale without surprises.
Frequently asked questions
What Gigapipe is and what it works with. For plans and billing, see the pricing page.
Get a Free Consultation with Our Observability Experts
Got questions or want to see how we plug into your Grafana setup? Reach out for a free consult.
Keep learning...
Rita Lopes | Oct 7, 2026
What If You Didn't Have to Migrate to Gigapipe to Find Out If It's Better?
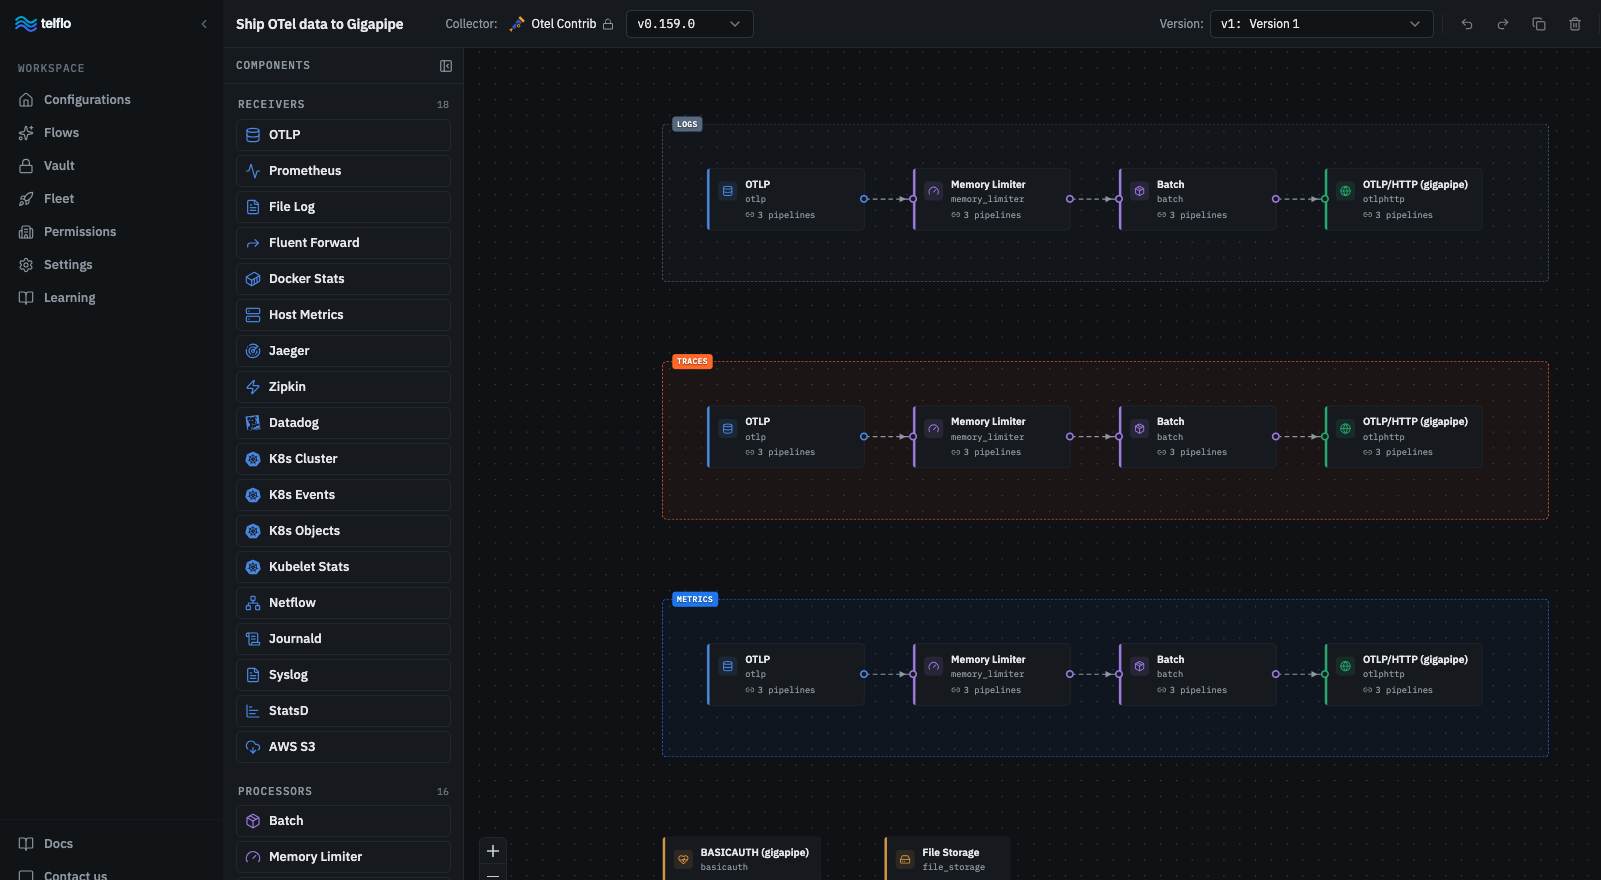
Dual-shipping OpenTelemetry is the safest way to test a new backend before migrating. Here's what the overlap costs — and why it just got cheap.

Rita Lopes | Jun 12, 2026
Wait, you can use ALL of Grafana Cloud's AI features for free?!
Grafana Cloud's free tier limits storage, not AI. Connect Gigapipe as your backend and get all the AI Grafana features at zero cost.

Rita Lopes | Jun 5, 2026
Your Monitoring Thinks 3 AM Looks Like 3 PM. That's Why You Miss Incidents.
Static alert thresholds miss context. Learn how anomaly detection learns your metric baseline and flags what's wrong - built into Gigapipe Cloud.

Rita Lopes | May 27, 2026
🤖 Your AI Agent Is Burning Money. You Just Can't See It Yet.
Token usage, latency, cost, and error rates for any AI agent framework — Claude, LangChain, OpenAI — in one Grafana dashboard. No new SaaS tool.
Trusted by Engineers
DNS & Infrastructure Observability
"Why Gigapipe? Native ClickHouse integration — you don't have to manage ingestion manually. Scalable — handles large volumes of DNS query/response logs without bottlenecks."
Vladimir Dulenov
Site Reliability Engineer
Kubernetes Auto-Instrumentation
Gigapipe is an officially supported observability destination in Odigos — the open-source Kubernetes auto-instrumentation project. Supports Traces, Metrics, and Logs out of the box.
Odigos
Open-Source Project — CNCF Ecosystem