🏁 Get Started with Gigapipe Managed Cloud
Welcome to your ready-to-use managed Observability stack - just add data ☘️
Step 1
Access your Gigapipe account and generate a scoped token to read/write data

Step 2
Configure your Observability Agent to send Logs, Metrics and Traces to Gigapipe
⭐ Use any Loki, InfluxDB, Elastic compatible Agent or Client
📦 Grafana Alloy
📦 Grafana Agent
📦 Vector
📦 Opentelemetry
📦 Telegraf
📦 Fluentd
📦 Logstash
Step 3
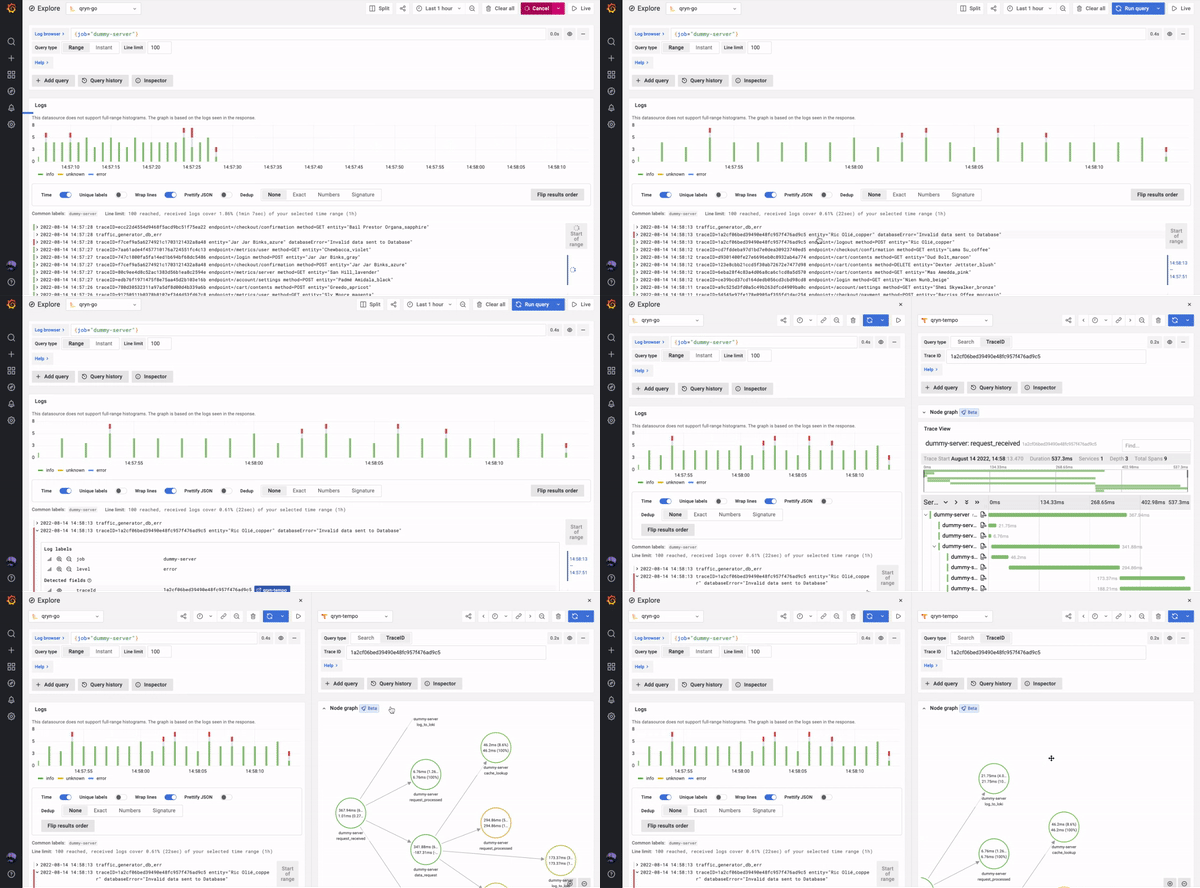
Access Grafana to auto-connect your Datasources and start Exploring your data

⭐ Explore Logs using the native Loki Datasource
Step 4
Sky is the limit! Any tutorial or example from Grafana Cloud should work as-is in Gigapipe.

Step 5
There's no step 5! You're already done! 🎉
If you've used Grafana or Grafana Cloud before, You will feel right at home.
... and since there's nothing new to learn, the Team can just focus on data.
Whoo-hoo! 🎉
Advanced Features
Dealing with a high-cardinality dataset? Keep your performance in check with our advanced options.


Activate your Gigapipe Account before proceeding!
Need Assistance? Contact our Support Team

