How important is observability?
Good observability is the cornerstone to maintaining and shipping good, bug free software effectively and efficiently to organizations of any size. Whether you’re a small start up or a fortune 500 company, clear monitoring over your distributed applications is imperative. Setting up your observability solution can be done in a variety of ways, each with their pros and cons. Either largely distributed systems, or all-in-one platforms. Qryn offers the best of both worlds.

Drop in replacement
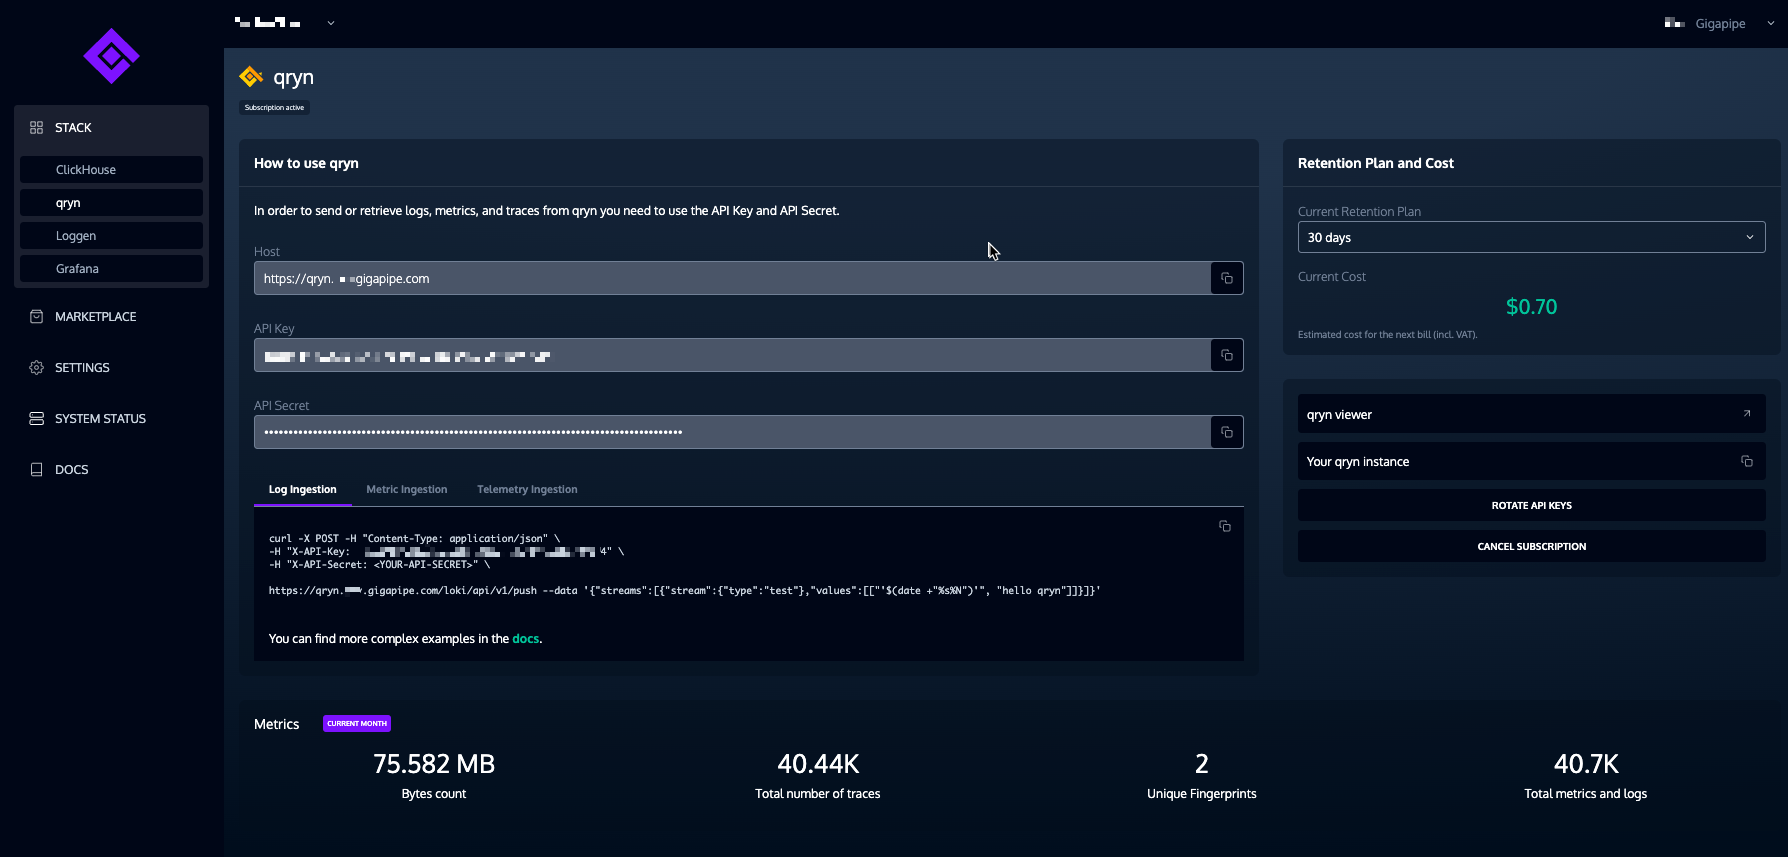
Get qryn set up instantly by simply changing the host using your existing client (Grafana Agent, OpenTelementry, Vector, Datadog, Telegraf/Influx, Logstach/Elastic, paStash, Promtail, Fluentd, Docker, Cloudflare or Curl!
By being easy to drop in/out qryn Cloud avoids hard vendor locking. Migrate to or away at any time.
Unified data layer
Correlation between Logs, metrics and traces makes analyzing events and debugging simple and efficient. Query your data back in any of our popular standard languages from LogQL, PromQL and Tempo (TraceQL) and even Flux!


Metered usage, only pay for what you use!
Pricing is clear and transparent, either subscription based or metered on GB ingested, and unique fingerprints (see the pricing calculators on each integration page for precise info). 4 different optional retention periods, as well as tiered options for larger scale data sets.
Distributed observability stacks
Largely distributed systems with individual data layers give you a wide range of options when it comes to ingestion formats, configuration and query languages. Using separate tools for metrics, logs and traces means analyzing particular events require much more effort to understand timeframes, query different tools, and build a correlation between metrics/logs/traces. This makes good observability very demanding.
All-in-one platforms
All in one platforms means your data is much more neatly correlated and together, however they often come with their own custom ingestion formats to master, as well as bespoke query languages to learn and become proficient in. This means migration as well as continued usage have a high learning curve and are difficult to move away from. They also come with a very hefty price tag a lot of scaling companies cannot afford.
Polyglot and correlated observability stack
Qryn offers the best of both worlds. A drop in replacement compatible with existing market standard clients that can be used immediately without plugins or modifications. Storing all your logs, metrics, traces & eBPF data in a single correlated data layer without the need for custom formats and query languages.

What our clients say
Frequently Asked Questions
Gigapipe is a managed platform for observability and monitoring tools. Single click deployments for all integrations as well as immediate interoperability between all applications (no code required!). Our primary general observability tool (qryn Cloud) comes with ingestion APIs transparently compatible with Loki, Prometheus, Tempo, InfluxDB, Elastic and more.
You decide exactly which region your data services are deployed in and your data will never leave that region unless specified. Your data flows between the deployed services, never directly through Gigapipe itself.
Gigapipe has an available free tier for individual engineers or developers. This is free forever. Organization mode has a monthly fee of $249 which allows access to higher tiers of some integrations, as well multiple projects/environments, multiple users and teams as well as advanced role based access control.
Each individual integration has its own pricing model based on the service. Either flat subscriptions or metered usage.
With a single click! Gigapipe not only creates and deploys your services, but it also connects them all together. You can link deployed data services together at the click of a button from within the stack.
Not at all – it replaces them. We simply allow using Grafana (the user-interface, unmodified) and its native datasources, while all other components and APIs are entirely provided by qryn and ClickHouse. qryn is a clear room implementation and it is not a fork and does not contain any code from Grafana or its projects.
Alternatives play an important role and can accelerate evolution in an lively ecosystem. qryn is just designed to make its end users happy and was implemented as a transparent, smart, lightweight overlay on top ClickHouse, where all data ingested across protocols sits ready to be accessed, analyzed and correlated in thousands of way today and into the future leveraging its fast and ever growing capabilities.
If you’re using any of the many compatible clients, then simply a the host to the qryn host and it is an automatic drop in replacement. Logs, Metrics and traces will be transparently ingested and immediately available through qryn!
For a full list of compatible clients for logs, metrics and traces please check here: https://qryn.metrico.in/#/logs/ingestion
Simple. You can connect any query or dashboarding application supporting Loki, Prometheus, Tempo/Opentelemetry APIs to qryn.cloud, without requiring plugins, extensions or modifications.
For example, Grafana native datasources can be used with qryn out of the box.
Get Started
Seeing is believing. Ready to try it for yourself?


